Physical Address
304 North Cardinal St.
Dorchester Center, MA 02124

Do you want to Create a Chart in the Livewire application?


So, this tutorial will guide us step-by-step on how to display data on line charts, area charts, bar charts, pie charts, and column charts in the Laravel 9 application using the Livewire package.
A chart combines text, symbols, and/or graphics to show the relationship between multiple data sets. They are a popular method for sharing information in different settings. For instance, a bar chart could show how sales of a particular flavor of ice cream have changed over the past five years. The length of each bar would indicate sales for that year.
Key features :
For more: https://www.netsuite.com/portal/resource/articles/erp/chart.shtml.
Okay, let’s get straight to the steps for the Livewire Registered user chart with an Example 👇
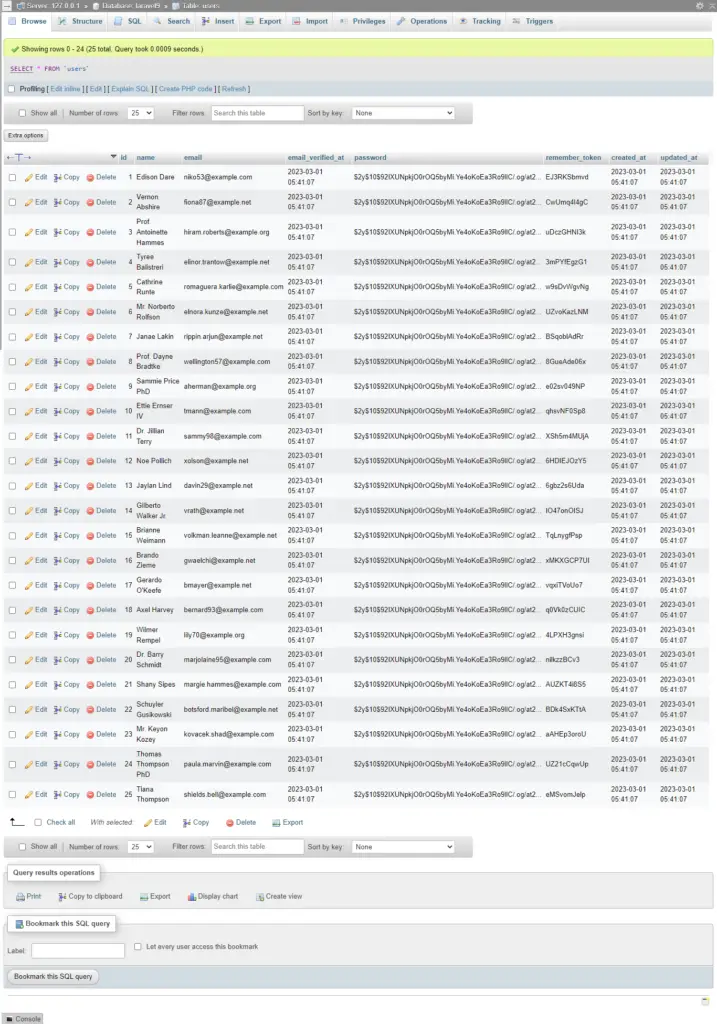
Insert Dummy Records using a Factory
database\Factories\UserFactory.php
<?php

namespace Database\Factories;

use Illuminate\Database\Eloquent\Factories\Factory;
use Illuminate\Support\Str;


class UserFactory extends Factory
{

    public function definition()
    {
        return [
            'name' => fake()->name(),
            'email' => fake()->unique()->safeEmail(),
            'email_verified_at' => now(),
            'password' => '$2y$10$92IXUNpkjO0rOQ5byMi.Ye4oKoEa3Ro9llC/.og/at2.uheWG/igi', // password
            'remember_token' => Str::random(10),
        ];
    }


    public function unverified()
    {
        return $this->state(fn (array $attributes) => [
            'email_verified_at' => null,
        ]);
    }
}
database\Seeders\DatabaseSeeder.php
<?php

namespace Database\Seeders;

// use Illuminate\Database\Console\Seeds\WithoutModelEvents;
use Illuminate\Database\Seeder;

class DatabaseSeeder extends Seeder
{
    /**
     * Seed the application's database.
     *
     * @return void
     */
    public function run()
    {
        \App\Models\User::factory(25)->create();
    }
}
Run the Seeder File
php artisan db:seed
Output :

Create a Livewire Component
php artisan make:livewire Admin\Analytics
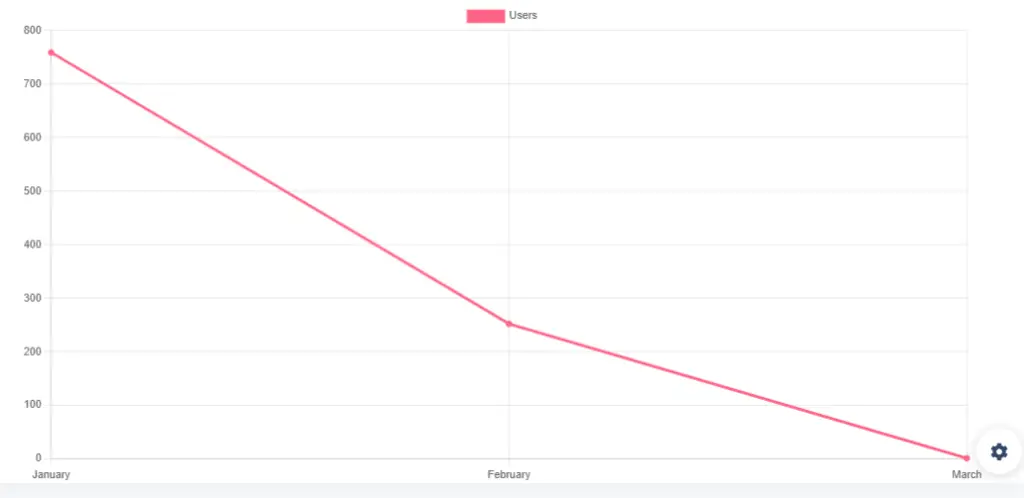
Okay, next we need to create a livewire component to create a view and logic for Creating all the registered users on monthly bases in Chart using chart js using Livewire. Please run the artisan command as above. From this command, it will generate two files located in the directory as below.
For more : https://www.chartjs.org/docs/latest
CLASS: app/Http/Livewire/Admin/Analytics.php
VIEW:  resources/views/livewire/admin/analytics.blade.php
routes/web.php
<?php
use Illuminate\Support\Facades\Route;
use App\Http\Livewire\Admin\Analytics;

#Graph Analytics
Route::get('/analytics-female-escorts',Analytics::class);
app/Http/Livewire/Admin/Analytics.php
<?php

namespace App\Http\Livewire\Admin;

use Livewire\Component;
use App\Models\User;
use DB;

class Analytics extends Component
{

    public function render()
    {
        #User Registrations accroding to Month

        $users = User::select(DB::raw("COUNT(*) as count"), DB::raw("MONTHNAME(created_at) as month_name"))
        ->whereYear('created_at', date('Y'))
        ->groupBy(DB::raw("Month(created_at)"))
        ->pluck('count', 'month_name');

        $userLabels = $users->keys();
        $userData = $users->values();
        return view('livewire.admin.analytics',compact('userLabels', 'userData'));
    }
}
resources/views/livewire/admin/analytics.blade.php
<div>
   <div class="col-12">
      <div class="card mb-4">
         <div class="card-header pb-0">
            <h6>Analytics</h6>
            <div class="container">
               <div class="row">
                  <div class="col-sm">
                     <canvas id="userChart"></canvas>
                  </div>
               </div>
            </div>
         </div>
      </div>
   </div>
</div>
@push('js')
<script src="https://cdn.jsdelivr.net/npm/chart.js"></script>
<script>
   var labels =  {{ Js::from($userLabels) }};
       var users =  {{ Js::from($userData) }};
      const data = {
         labels: labels,
         datasets: [{
           label: 'Monthly Registered Users',
           backgroundColor: 'rgb(255, 99, 132)',
           borderColor: 'rgb(255, 99, 132)',
           data: users,
         }]
       };
       const config = {
         type: 'line',
         data: data,
         options: {
         animations: {
         tension: {
         duration: 1000,
         easing: 'linear',
         from: 1,
         to: 0,
         loop: true
       }
     },
     },
   };
     const myChart = new Chart(
     document.getElementById('userChart'),
     config
   );
</script>
@endpush
Output :

I hope that this article helped you learn how to create a chart using Chart Js in the Livewire application. You may also want to check out our guide on Livewire Multiple Image Remove While Uploading.